
High-Performance Filterable Data Grid with CSV Export
Full-featured enterprise data table with multi-column sorting, fuzzy search, bulk row selection, and client-side CSV download.

Customize Placeholders in Real-Time
Replace the mock customer dataset with your specific database or CRM table schema.
Create an enterprise Data Table Component as a single-file Claude Artifact in React.

Features:
1. Dataset: 30 mock customer records with fields: ID, Name, Company, Plan, ARR ($), Status, Last Active, Actions.
2. Filtering & Search: Global fuzzy search box, multi-select Plan filter, and Status toggle chips.
3. Sorting: Clickable column headers with ascending/descending indicators and secondary sort support.
4. Bulk Actions: Checkbox select-all, individual row checkboxes, and a floating bulk-action toolbar (Delete Selected, Export Selected).
5. Pagination: Configurable rows per page (5, 10, 25) with page numbers and jump-to-page input.
6. CSV Export: One-click "Export to CSV" that dynamically compiles the currently filtered rows and triggers an instant browser download.
7. Polished dark mode layout with sticky table header.
Optimization Tips & Parameters
Click "Export to CSV" inside the Claude Artifact to generate a real client-side download.
Associated Tags & Use Cases
More claude artifacts ui Prompts
View full library → 1:1
Production SaaS Analytics Dashboard with Dynamic Charts
Prompts Claude 3.5 Sonnet to generate a self-contained, interactive single-file React Artifact with live filters, KPIs, and responsive charts.
Create a comprehensive, production-grade SaaS Financial & User Analytics Dashboard as a single-file interactive React Artifact. Requirements: 1. Tech Stack: React 18, Tailwind CSS, Lucide React icons, and Recharts (or pure SVG responsive charts). 2. KPI Cards: MRR ($124,500 +14.2%), Active Subscribers (3,420 +8.1%), Churn Rate (1.2% -0.4%), and LTV ($2,890). Include sparkline trend graphs. 3. Interactive Controls: Date range selector (Last 7 Days, 30 Days, 90 Days, 1 Year), Plan filter (All, Starter, Pro, Enterprise), and Currency switcher. 4. Visualizations: - Monthly Revenue & Expenses Stacked Area Chart with interactive tooltips. - Cohort Retention Heatmap matrix. - Top conversion channels breakdown bar chart. 5. Interactive Data Table: Recent high-value transactions with search, status badges (Paid, Pending, Refunded), sortable columns, and pagination. 6. Design: Modern dark-slate aesthetic (#0B0F19 background, subtle glassmorphism borders, accessible typography, smooth hover transitions). Provide the complete executable JSX/TSX without placeholders.
 1:1
Multi-Agent Autonomous Chat Interface with Live Stream
Creates a full-featured AI chat workspace artifact with agent switching, markdown message rendering, prompt starters, and token metrics.
Build a production-ready AI Copilot Chat Interface as an interactive Claude Artifact. Features required: 1. Sidebar: Conversation history with search, model/agent selector (Research Agent, Code Architect, Copywriter), and memory retention toggle. 2. Main Chat: - Message bubbles with distinct user/assistant styling. - Streaming simulated typing effect with cancel button. - Code blocks with syntax copy buttons and language pills. - Model latency (ms) and token counter telemetry pills. 3. Interactive Bottom Bar: Auto-resizing textarea, file attachment pill simulation, quick prompt chips, and voice input toggle button. 4. UI States: Empty state with starter prompts, active conversation state, and loading skeleton state. 5. Deliver as a complete, fully functional React component using Tailwind CSS and Lucide icons.
 1:1
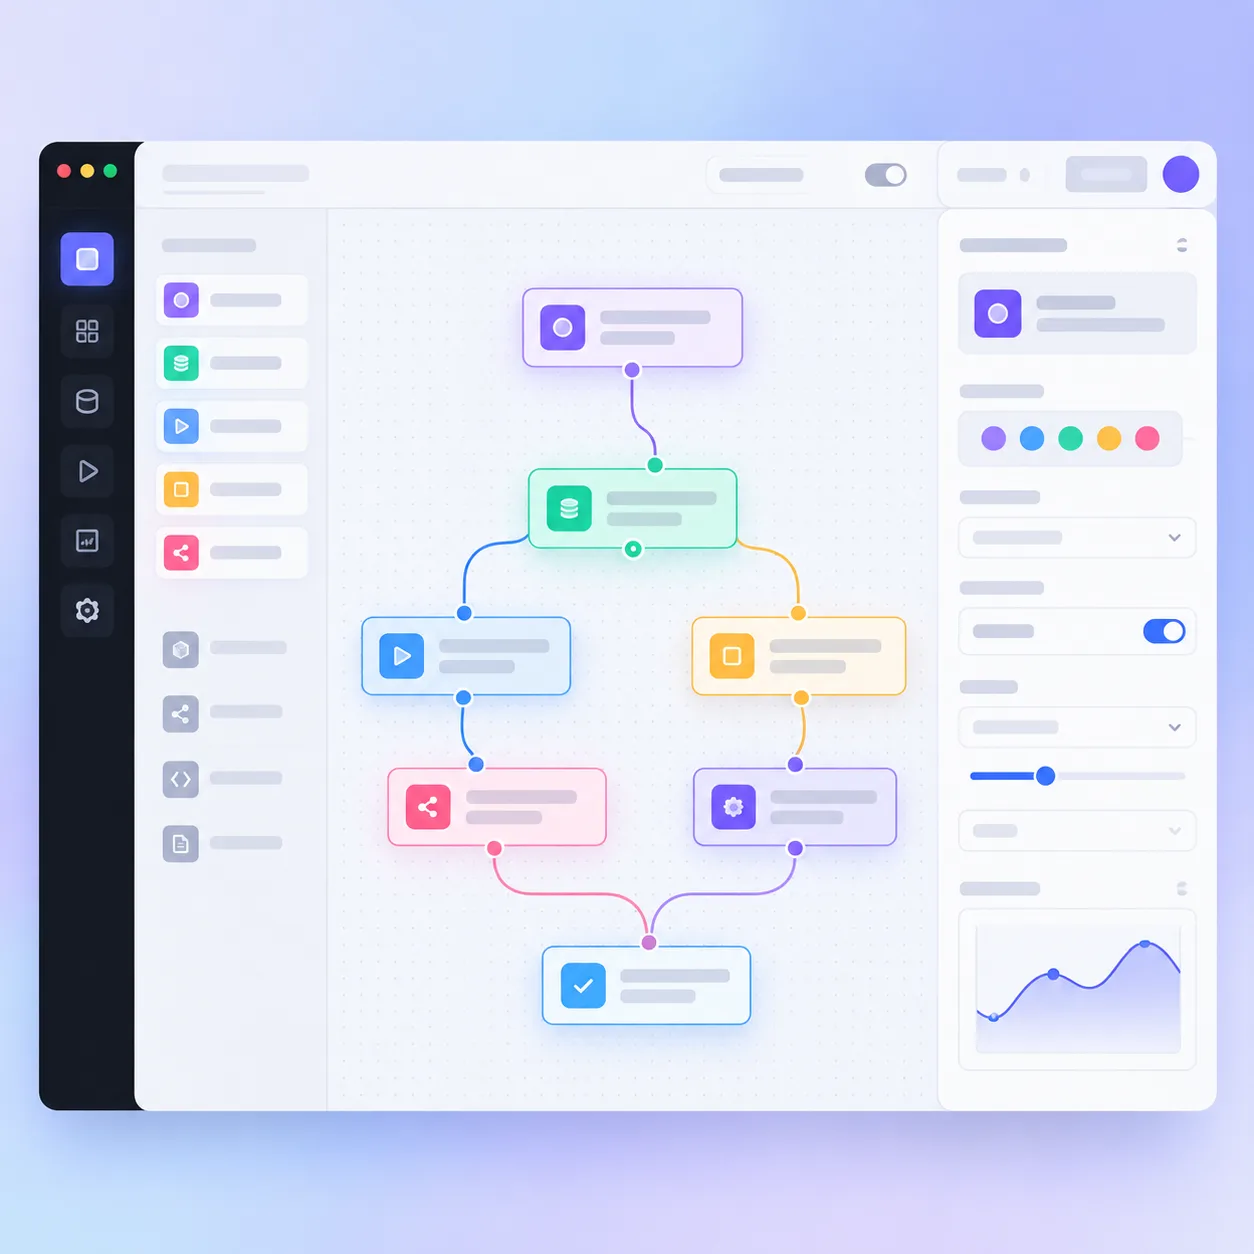
Interactive Drag-and-Drop Workflow Diagram Editor
Renders an interactive canvas artifact for connecting workflow nodes with dynamic bezier curves and state management.
Create an interactive Node-Based Workflow Builder as a single-file Claude Artifact in React. Requirements: 1. Canvas: Infinite-feeling grid canvas with pan and zoom controls (+, -, reset). 2. Draggable Nodes: Nodes representing "Webhook Trigger", "LLM Processing", "Branch Condition", and "Database Write". 3. Dynamic Connections: Draw smooth SVG cubic bezier curves between node connector ports that update dynamically as nodes are dragged. 4. Node Inspector: Clicking a node opens a side properties panel to edit node label, parameters, and retry count. 5. Export: Button to export the graph state to structured JSON. 6. Styling: High-tech dark theme, crisp SVG paths, glowing connection ports, and keyboard shortcut helpers. Complete executable code.